

By: Justin Quinton, Glenn P. Jenkins, Godwin Olasehinde-Williams
ABSTRACT
Faced with a significant devaluation of its currency and a surge in food prices, the Nigerian government prohibited the use of foreign currency for food imports. This essentially blocked the importation of numerous food items under the guise of stimulating the domestic output of these staples. Consequently, food prices in Nigeria increased despite a global decline in food prices, and the incidence and severity of food insecurity escalated. This study examines the changes in the types and severity of coping mechanisms for food insecurity resulting from the food price shock caused by the oil price crash, currency devaluation, and restrictions on foreign exchange. Nigeria’s General Household Survey Panel data from 2012 and 2015, during periods of high oil prices, is compared with data from 2018 when oil prices had remained low, the currency had been devalued, and the treasury had been depleted. Alongside detailed descriptive statistics, logistic and hurdle regressions are employed for statistical analysis. Findings indicate a rise in the percentage of Nigerian households grappling with food insecurity from 2015 to 2018. During this period, 68.7% of households resorted to at least one coping mechanism, 31.8% adopted six or more coping strategies, and 43.2% resorted to severe coping strategies. The issue stems not primarily from natural disasters or conflicts but from a failure in macroeconomic and agricultural economic policies. Our findings confirm that these policies come at great cost, particularly to female-headed households, single-parent households, households headed by elderly people, and other vulnerable populations, pushing them deeper into food insecurity.
1 Introduction
Food insecurity remains a key concern in Nigeria. In this study, we investigate the effect of an adverse food price shock on household food insecurity coping behaviors. The mechanism for initiating this food price shock in Nigeria was the collapse in oil prices and the associated currency devaluation, which began in 2014 and continued until mid-2016. During this period, oil prices remained below 60 USD/bbl. Moreover, foreign exchange restrictions imposed on over 40 imported food items further created a huge food supply gap in the country. The combination of these factors led to high prices for food imports.
From 2000 to 2014, Nigeria’s economy enjoyed robust and sustained growth, averaging over 7% annually. This growth was supported by favorable global conditions, increased crude oil price, effective macroeconomic policies, structural reforms, and increased output.1 However, post-2015, growth rates slowed and GDP per capita stagnated. This slowdown was caused by issues such as distortions in monetary and exchange rate policies, increasing fiscal deficits due to reduced oil production and an expensive fuel subsidy program, heightened trade protectionism, and external shocks.2 These weakened economic fundamentals led to inflation reaching a 24-year high of 31.7% in February 2024. This, coupled with sluggish economic growth, has pushed millions of Nigerians into poverty.
Despite years of high oil revenues between 2004 and 2012, the Nigerian government failed to adequately stimulate investment in domestic food production and became increasingly reliant on imported food. In 2009, oil prices started a meteoric rise from 45 to the 80 USD/bbl range throughout 2010. By 2012 and 2013, oil prices ranged from 98 to 128 USD/bbl. During those years of high oil prices, Nigeria became heavily reliant on readily available foreign exchange with which imported food was bought cheaply. Indeed, the behavior of the government indicated that oil prices were expected to stay high for years to come. However, by January 2015, oil had fallen back to 49 USD/bbl and did not break the 60 USD/bbl mark again until November 2017.
Globally, the price of oil has been identified as an important factor that affects food prices (Sun et al. 2023). Unsurprisingly, Nigeria experienced a corresponding food price shock when the oil price fell precipitously between 2014 and 2016. Several theoretical channels through which this occurs are already documented in the literature. For one, increases in oil prices often induce currency depreciation, and the associated exchange rate changes are capable of raising the prices of agricultural inputs, which in turn leads to food price increases (Nazlioglu and Soytas 2011). Rising oil prices also often induce inflationary effects, which in turn cause an upsurge in food prices (Choi et al. 2018; Cologni and Manera 2008). Higher oil prices are also capable of triggering a substitution effect toward crop-based alternatives such as biodiesel and ethanol (Mokni and Ben-Salha 2020).
In addition, the reactive food import policy of restricting the use of foreign exchange for the import of food items and other basic goods introduced by the Nigerian government drove inflation even higher. The policy exacerbated the prevalence and severity of household food insecurity in Nigeria at a time when prices were already rising rapidly due to exchange rate adjustments. Theoretically, it was believed that the policy would conserve foreign exchange by stimulating domestic agricultural output of staples (Alake 2021). However, in the short to medium term, Nigeria has a limited ability to grow and process or refine these goods at the quantities previously imported. Among other factors, the lack of access to efficient irrigation systems, of good transportation systems, and of sufficient credit to modernize production techniques makes it difficult for Nigerian farmers to meet domestic demand (SB Morgen 2021). For instance, in 2019 the Nigerian economy produced just 1.2% and 4.7%, respectively, of the total amounts of wheat and sugar consumed domestically (Alake 2021). These items were added to the foreign exchange restriction list in 2020. Clearly, Nigeria lacks the capacity to produce anywhere near the amount of the staples imported in recent years. Thus, the policy ended up instead effectively banning the import of many staple food items to Nigeria and, significantly, led to higher food prices. This confirms the claim of Reuters and Ohuocha (2021). Consequently, real food prices rose by 37.0% from 2012 to 2018 in Nigeria, despite real food prices falling globally by 21.9% between 2012 and 2018 (FAO 2021). This effect is in line with what has been documented in the literature, that is, that foreign exchange controls are capable of causing changes in the domestic prices of imports (see Tamirisa 1999).
In response to the idiosyncratic adverse food price shock resulting from the combined effect of the oil price crash, currency devaluation and foreign exchange restrictions, food-insecure households in the country have been forced to adopt various coping techniques. Such coping strategies, broadly categorized as food- and non-food-based techniques adopted to meet basic needs, reflect the degree of vulnerability of the households (Kyaw 2009; Ruel et al. 2010). Some examples of these strategies include purchasing less of the preferred food, reducing meal sizes, and skipping meals when there is a food shortage (Farzana et al. 2017; Gundersen and Ziliak 2014; Gupta et al. 2015). A detailed understanding of the coping strategies adopted by food-insecure households in Nigeria is crucial to the formulation and implementation of food security programs and policies in the country, especially in periods of financial or economic shocks.
The main aim of this article is thus to provide empirical evidence on the nature of coping strategies commonly adopted in Nigeria. To this end, changes in the types and severity of food insecurity coping behaviors are analyzed in 2012, 2015, and 2018. Specifically, we compare Nigeria’s General Household Survey Panel data from 2012 and 2015, when oil prices were high (or had only recently fallen), with data from 2018, when oil prices had been persistently low, the currency had been devalued, and the treasury had been depleted. We examine the way households have coped with food insecurity and how the coping behavior has evolved over time with the increased escalation of real food prices. Furthermore, the socioeconomic and demographic characteristics of food-insecure households that influence their adoption of some specific strategies are analyzed. It is noteworthy that this study is the very first to empirically examine the coping strategy responses triggered by the 2015 oil price shock and the foreign exchange restrictions imposed by Nigeria.
The paper proceeds as follows. In Section 2, we present the literature review on the causes and consequences of coping behaviors for food insecurity in general and for Nigeria in particular. In Section 3, we describe the data and methodology. Detailed descriptive statistics and regression results are presented in Section 4, and Section 5 concludes with a discussion of the policy implications of these findings.
2 Literature Review
Numerous studies have been carried out globally to understand the experiences of households affected by food insecurity. An important fact identified by such research is that systemic and/or idiosyncratic shocks such as those caused by sudden food price increases (see Christian 2010; FAO 2008; Nakanwagi, Ntuli, and Muchapondwa 2021; Quisumbing, Meinzen-Dick, and Bassett 2008) or global economic crises (see Ivanic and Martin 2008; Ivanic, Martin, and Zaman 2012; Nekmahmud 2024) have adverse effects on the food security of nations. In response to such shocks, households are often forced to adopt certain coping strategies to mitigate the effect of food unavailability (Danso-Abbeam, Asale, and Ogundeji 2023; Devereux 2001). According to Kyaw (2009), households adopt a range of coping strategies in response to food insecurity that reflect their level of vulnerability. These coping strategies, according to Snel and Staring (2001), are defined as the set of choices made by households belonging to poor socioeconomic groups to minimize expenses or improve income so as not to fall too far beneath the society’s welfare level. Gupta et al. (2015) and Mabuza, Ortmann, and Wale (2016) describe these coping strategies as strategic plans to deal with food unavailability made by households at risk of food insecurity. According to Biadgilign (2023), coping strategies are methods adopted by households or individuals who are unable to access adequate amounts of food.
Coping strategy choices, however, generally vary across households and even within households (Maxwell and Caldwell 2008). Similarly, coping strategy choices often differ based on the degree of poverty severity (Mjonono, Ngidi, and Hendriks 2009). Farzana et al. (2017) claim that the greater the severity of food insecurity, the more inclined households are toward the adoption of a wider range of coping strategies. Coping strategies for food insecurity can be broadly classified into income-soothing strategies and consumption-soothing strategies (see Grobler 2014; Shamsudin 2019). Davies (1993) classifies the former as strategies related to income diversification and alternative food sources. The latter, meanwhile, refers to strategies used to modify consumption, such as food intake reduction or reduction in the number of household members entitled to meals. Farzana et al. (2017), in a similar manner, report that when faced with idiosyncratic shocks such as sudden food price increases, vulnerable households adopt various coping strategies that can be broadly grouped into food- and non-food-based strategies. Either or both food or non-food coping strategies are generally employed in dealing with food insecurity (FAO 2013; Ruel et al. 2010).
Some of the more commonly adopted coping strategies identified in the literature include settling for less preferred food types, reduction in meal quantity, consuming only one type of meal, usually the cheapest available, skipping meals, and selling assets to meet food requirements (Gundersen and Ziliak 2014; Gupta et al. 2015). Studies such as those by Akerele et al. (2013), Biadgilign (2023), Chaudhuri et al. (2021), Dlamini et al. (2023), Orewa and Iyangbe (2010), Sani and Kemaw (2019), and Tsegaye et al. (2018) likewise identify meal skipping and consumption of less expensive food types as some of the commonly used coping strategies. Gupta et al. (2015) report that over 60% of food-insecure households in Delhi, India, rely on the consumption of less preferred and cheaper food types as their coping strategies for food insecurity. The remainder rely instead more on meal size reductions. Studies conducted by authors such as Dore, Adair, and Popkin (2003), Kempson et al. (2003), Mabuza, Ortmann, and Wale (2016), and Norhasmah Jr et al. (2010) have also shown that the most popular kind of coping strategy adopted by food-insecure households is the consumption of less expensive food types. Uddin (2012) identifies additional coping strategies, such as wild food consumption, selling labor cheaply, securing high-interest loans, farming short-duration crops, appealing to social networks and begging. Diversification of income sources, mortgage or sale of landed properties, and seasonal migration are some other types of coping strategies noted in the literature (see Banik 2007; Mishra 2007).
This review of the literature shows that extensive research has been conducted on food insecurity coping strategies around the world. However, it also shows that no study has so far considered the specific coping strategy response of poor Nigerian households to the food price shock induced by the combined effect of the oil price crash, currency devaluation and foreign exchange restrictions. This gap in the literature is the motivation for this study. While food prices have been falling and the prevalence of undernourishment has declined in nearby countries such as Cameroon and Ghana, it has been on the rise in Nigeria (FAO et al. 2019). This was triggered by the exogenous shock to the exchange rate, exacerbated by a failure of agricultural policy, trade policy and food security policy. This study sheds light on the impact of these challenges on households in Nigeria.
3 Data and Methodology
3.1 Data
The primary data source for this study is the Nigerian General Household Survey—Panel (GHS-P). This survey is conducted approximately every three years. The GHS-P is a nationally representative sample that is also representative of each of the six geographic zones in Nigeria. This study uses data from three waves of the GHS-P enumerated in 2012, 2015, and 2018. Within each wave, each household is visited twice—once in the pre-harvest period in September to November, and once in the post-harvest period in February to April. In this study, we use food insecurity data from the pre-harvest visit. After data cleaning, the sample for this study consists of 13,923 observations across three waves of the survey: 4518 households in 2012, 4487 households in 2015, and 4918 households in 2018.
The first step in this analysis is to identify all households that are coping with food insecurity (frequency) and to separate them from the households that are not coping. The households we consider to be coping in this study are those that respond to at least one of the nine questions describing households’ experience coping with food insecurity (Table 1). A household is classified as non-coping if they did not engage in any food insecurity coping behaviors in the previous 7 days. This coping indicator serves as the first dependent variable for the empirical analysis.
TABLE 1. Food insecurity coping variables and severity.
| Variable | Description of variable | Severity |
|---|---|---|
| Less preferred | Unable to eat healthy and nutritious/preferred foods | Mild |
| Limit type | Ate only a few kinds of foods | Mild |
| Limit portion | Had to limit portion size | Moderate |
| Reduce | Had to skip a meal | Moderate |
| Restrict | Had to restrict adult consumption for children | Moderate |
| Borrow | Had to borrow food or rely on help | Moderate |
| None | No food in the household | Intense |
| Sleep hungry | Had to go to sleep hungry | Intense |
| Whole day | Had to go a whole day and night without eating | Intense |
Source: Nigeria GHS-P 2012, 2015, and 2018.
The second dependent variable used for empirical analysis is the severity index (SIN). This indicator establishes the severity of food insecurity by aggregating the number of various coping behaviors in which the sampled households engaged. The index is constructed (Equation 1) as the simple sum of the number of coping behaviors engaged in, which ranges from 1 to 9. For household in period we have:

An alternative severity measure of coping behaviors based on the Household Food Insecurity Prevalence (HFIAP) is also constructed. In this case, we adapt the general principles of the HFIAP approach used by the United States Agency for International Development (Coates and Swindale 2007) to categorize households into four classes of food insecurity based on responses to nine food insecurity coping questions. First, the responses are grouped into four categories—none, mild, moderate, and intense—according to the degree of severity they represent (Table 1). Essentially, a household is classified by the most severe coping behavior in which they engaged. Households that do not engage in any of the food insecurity coping behaviors are considered food-secure (HFIAP = 1). Mild food insecurity (HFIAP = 2) is defined as eating less preferred/nutritious foods or limiting the types of food (i.e., eating a monotonous diet) with no reported reduction in portion size or skipping meals. A household is moderately food-insecure (HFIAP = 3) if its members are reducing caloric intake (e.g., skipping meals or limiting portion size) or borrowing food, but do not engage in any of the three most severe coping behaviors. Finally, a household is severely food-insecure (HFIAP = 4) if it engages in any of the three most intense behaviors, which are having no food in the house, going to sleep hungry or going a whole day and night without eating. The construction of the HFIAP index is highlighted in Equation (2).

Overall, these variables are used to assess first the existence of coping behaviors, then their severity. They are defined in Table 2, rows 1–3.TABLE 2. Variables of interest.
| Variable | Description of variable | Variable type |
|---|---|---|
| Dependent | ||
| Coping | Household engaged in any of the nine coping behaviors = 1 and 0 otherwise | Indicator |
| FIN | Sum of the number of coping behaviors engaged in, ranging from 1 to 9 | Discrete |
| HFIAP | Food-secure = 1; Mildly food-insecure = 2; Moderately food-insecure = 3; Severely food-insecure = 4 | Discrete |
| Independent | ||
| Year | 2012, 2015, 2018 | Indicator |
| log(dist_market) | Log of distance in km from household to agricultural market | Continuous |
| log(age) | Log of the age of head of household in years | Continuous |
| Agriculture | Household member(s) involved in agriculture = 1 and 0 otherwise | Indicator |
| Single_parent | Lone adult as head of household that is divorced, separated or widowed and lives with children = 1, 0 otherwise | Indicator |
| Polygamous | Head of the household is in a polygamous marriage = 1 and 0 otherwise | Indicator |
| log(tot_exp_capita) | Real (2012 N) annual per-capita household expenditure | Continuous |
| hh_employed | Head of household is considered employed if they are involved in agriculture, working as an employee or are self-employed = 1 and 0 otherwise | Indicator |
| Own_home | Home ownership = 1 and 0 otherwise | Indicator |
| hh_educ | Educational attainment of the household head: No education; Senior Secondary School Certificate (SSSC) or less; Undergraduate, professional or technical degree; Graduate degree | Indicator |
| Urban | Urban household = 1 and rural household = 0 | Indicator |
| prop_children | Proportion of household members less than 18 years of age | Continuous |
| hh_size | Number of household members | Discrete |
| n_elderly | Number of household members over the age of 85 | Discrete |
| Zone | Indicating which of the six geopolitical zones of Nigeria the household lives in North Central, North East, North West, South West, South Central and South South | Indicator |
Source: Nigeria GHS-P 2012, 2015, and 2018.
Independent household characteristics considered as determinants of coping behaviors are outlined in Table 2, rows 4–19, and include the following: the survey year, log of distance to the agricultural market (km), log of the age of the head of household, if the household is involved in agriculture, if the head of household is a single parent, if the household is polygamous, household expenditure (total and per capita), if the head of the household is employed, if the family owns the home, the educational attainment of the head of household, if the household is urban, the proportion of household members that are children, household size, the number of elderly household members (85 years of age and older), and the geopolitical zone of Nigeria in which the household lives.
3.2 Methodology
First, detailed statistics are presented on the prevalence of coping behaviors and household characteristics, broken down by survey wave. These statistics include the proportion of households coping with food insecurity, the prevalence of each specific coping behavior, and the proportion of households within each class of severity of food insecurity. We then present descriptive statistics and significance tests on the means of variables of interest (e.g., total expenditure) by classification (e.g., coping vs. non-coping) to illustrate differences between groups.
Next, a hurdle regression is implemented to assess the determinants of households coping with food insecurity in Nigeria in 2012, 2015, and 2018. The first stage of the hurdle regression is a logistic regression showing whether or not the household engages in any of the coping behaviors. The second stage, conditional on a household coping, is a negative binomial on the count of coping behaviors in which a household engages (using the frequency index as the dependent variable). We conduct a statistical test to confirm that a hurdle model is, indeed, necessary due to the excess number of zeros in the number of coping behaviors engaged in. Equations (3) and (4) present the hurdle model.
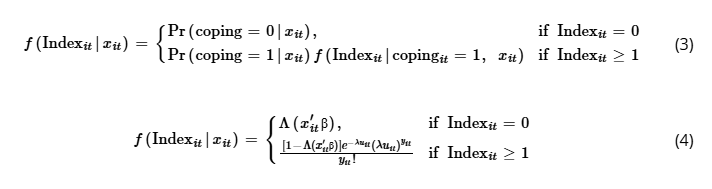
where: Λ(∙) = Logistic distribution, x = Vector of household characteristics, β = Vector of coefficients, λ = Conditional mean of coping behaviors, = Error term, and = Count of coping behaviors.
Finally, we carry out a logistic regression on households struggling with moderate and intense food insecurity to investigate the factors that tip a household into the most severe coping behaviors, most of which involve the household running out of food entirely at times. In all regressions, time effects are accounted for by using an indicator variable for each wave of the survey, with 2012 as the base year. Regional differences are captured by using an indicator variable for each of the six geopolitical zones of Nigeria, with all differences relative to the North Central zone. To account for repeated observations at the household level, we cluster standard errors by household. To account for unobservable differences at the local level, standard errors are clustered by enumeration zone.
4 Results and Discussion
4.1 Prevalence of Coping Behaviors
Table 3 presents the proportion of households coping with food insecurity by severity. In 2012 and 2015, just over half of households coping with food insecurity were moderately food-insecure, with the remainder roughly split between mild and severe—effectively a normal distribution. However, by 2018 the distribution becomes severely skewed, with over 62.9% of food-insecure households severely food-insecure, a 42.9 pp. increase from 2015, 21.0% moderately food-insecure, and just 16.1% mildly food-insecure.TABLE 3. Prevalence of food insecurity by year.
| Year | Food-secure | Food-insecure | Severity of food insecurity | ||
|---|---|---|---|---|---|
| Mild | Moderate | Intense | |||
| 2012 | 47.6% | 52.4% | 26.5% | 52.2% | 21.4% |
| 2015 | 42.5% | 53.5% | 24.3% | 55.7% | 20.0% |
| 2018 | 31.3% | 68.7% | 16.1% | 21.0% | 62.9% |
Source: Nigeria GHS-P 2012, 2015, and 2018.
Clearly, the food insecurity situation in Nigeria has both broadened and deepened as more households have been affected and the severity has worsened. Of the 68.7% of coping households, 62.9% are severely food-insecure. This means that 43.0% of all households in Nigeria experienced severe food insecurity in 2018, which very closely matches the 2018 estimate from the Nigerian National Bureau of Statistics (2020a, 2020b) of 40.1% of households in extreme poverty.3 The finding also lends credence to the conclusion reached by Thomas et al. (2023), who through the 2018–2019 household survey of expenditures reveals that about 40% of the Nigerian population is food-insecure. This outcome also supports the finding by Mekonnen et al. (2021), who with the same survey data show that close to 30% of the population is food-insecure. This result gives further insight into the meaning of extreme poverty—these households are suffering from caloric deficiencies and malnutrition, and are, at times, completely out of food. This increase in the prevalence and severity of food insecurity is due to the rise in real food prices caused by the real currency devaluation triggered by the oil price collapse. This effect is quite similar to what has been documented in studies by Choi et al. (2018), Cologni and Manera (2008), and Nazlioglu and Soytas (2011). The adverse effect of these economic shocks has been further exacerbated by the ban on the use of foreign exchange to import food. Our finding thus confirms the claim by Reuters and Ohuocha (2021) that the policy ended up effectively banning the import of many staple food items to Nigeria, leading to higher food prices. It also corroborates the conclusion of Tamirisa (1999) that foreign exchange controls often cause changes in the domestic prices of imports.
In Table 4, the prevalence of each coping behavior is presented separately. The prevalence of all coping behaviors increased between 2012/2015 and 2018, and most coping behaviors increased by significant amounts. The largest increases occurred for two severe coping behaviors—households having no food in the house (+39.7 pp) and households that went to sleep hungry (+36.2 pp). Considering that in 2012/2015, these proportions averaged 16.1% (no food in the household) and 13.4% (going to sleep hungry), these increases are alarming. In terms of moderate coping behaviors in 2018, nearly three-quarters of all Nigerian households limited portion sizes at meal times (72.7%) and over three-fifths (60.3%) reduced the number of meals per day for all household members. As food prices rose, households shifted from dietary diversity to calorie‐dense staples. This shows overwhelmingly that the food insecurity crisis has increased in severity in Nigeria. This shift reveals how economic stress alters consumption behavior; not merely by reducing quantity but by transforming the nutritional quality of diets.
TABLE 4. Prevalence of coping behaviors by year, coping households.
| Coping behavior | Severity | 2012/2015 | 2018 | Change |
|---|---|---|---|---|
| Eating less preferred foods | Mild | 85.6% | 87.1% | 1.5 |
| Limiting types of food | Mild | 81.3% | 83.8% | 2.5 |
| Limiting portion size | Moderate | 62.0% | 72.7% | 10.7 |
| Reducing number of meals | Moderate | 53.6% | 60.3% | 6.7 |
| Restricting adult consumption | Moderate | 29.0% | 41.8% | 12.8 |
| Borrowing food | Moderate | 16.3% | 26.8% | 10.5 |
| No food in the household | Severe | 16.1% | 55.8% | 39.7 |
| Going to sleep hungry | Severe | 13.4% | 49.6% | 36.2 |
| Going a whole day and night without eating | Severe | 6.2% | 19.4% | 13.2 |
Source: Nigeria GHS-P 2012, 2015, and 2018.
4.2 Household Characteristics
In Table 5, we compare the descriptive statistics between 2012/2015 (pooled) and 2018 for coping households to investigate how the characteristics of these households have changed. Considering food insecurity statistics among coping households, the mean number of coping behaviors increased from 3.6 to 5.0, a statistically significant increase of 38.9%. The severity of food insecurity also increased; 62.9% of all coping households were severely food-insecure in 2018, a 42.2 pp. increase from 2012/2015 when just 20.7% of households were severely food-insecure. F-tests on the equality of means between the years (column VI, rows 1–5) and chi-squared tests on the equality of proportions are conducted where appropriate (column VI, rows 6–18), Quinton, Jenkins, and Olasehinde-Williams (2023) find that polygamous households, households where the head is employed, and more highly educated heads of household had lower incidences of food insecurity. However, in 2018, the proportion of polygamous households coping with food insecurity increased by 2.4 pp., and the proportion of coping households with heads of household who are employed and more highly educated also increased. This is indicative of the broadening of the Nigerian food security crisis to include households not typically affected by food insecurity in previous years. Finally, we find that coping households in 2018 tend to have fewer household members and a higher proportion of members who are children.TABLE 5. Coping household descriptive statistics by year, 2012/2015 and 2018, Nigeria.
| Variable | 2012 and 2015 | 2018 | Test for equality of means | ||
|---|---|---|---|---|---|
| Mean | SD | Mean | SD | F-test | |
| Coping behaviors | 3.6 | 2.04 | 5.0 | 2.57 | F = 696.833* |
| Real household expenditure (000 s) | 335.4 | 265.3 | 341.4 | 281.5 | F = 0.952 |
| Real household expenditure per capita (000 s) | 78.5 | 87.3 | 89.7 | 95.3 | F = 30.505* |
| Proportion of children | 0.42 | 0.26 | 0.48 | 0.36 | F = 79.135* |
| Household size | 5.6 | 3.1 | 5.1 | 3.2 | F = 47.4* |
| N | Percent | N | Percent | Chi-squared test | |
| Severity of coping | 4945 | 3379 | χ2 = 1565.97* | ||
| Mild | 1252 | 25.3% | 544 | 16.1% | |
| Moderate | 2671 | 54% | 709 | 21% | |
| Severe | 1022 | 20.7% | 2126 | 62.9% | |
| Agricultural | 3191 | 64.5% | 2559 | 75.7% | χ2 = 117.41* |
| Polygamous | 717 | 14.5% | 571 | 16.9% | χ2 = 8.65* |
| Employed | 4216 | 87.9% | 2987 | 90% | χ2 = 8.53* |
| Homeowner | 3509 | 71% | 2070 | 61.3% | χ2 = 85.27* |
| Education | 4945 | 3379 | χ2 = 69.94* | ||
| None | 2340 | 47.3% | 1293 | 38.3% | |
| SSSC or lower | 2122 | 42.9% | 1658 | 49.1% | |
| Professional degree | 269 | 5.4% | 242 | 7.2% | |
| University degree | 214 | 4.3% | 186 | 5.5% | |
- Note: Statistical significance markers: *p < 0.01.
Source: Nigeria GHS-P 2012, 2015, and 2018.
Notably, since real household expenditure does not decline and real expenditure per capita actually increases between 2012/2015 and 2018, we conclude that the increase in food insecurity is almost entirely due to the price shock, rather than an income shock. The income and substitution effects of this food price shock on the consumption of other basic needs, such as health expenditure, warrant further study. The poorest quintile bore the greatest welfare loss, equivalent to about one-fifth of annual income. This finding highlights the regressive nature of the food price shock and shows how vulnerability deepens along the income distribution.
Descriptive statistics by change in food security status are presented in Table 6. We present three groups based on their change in food insecurity status between 2015 and 2018. As the names imply, the transitory insecure group comprises households that were food-secure in 2015 and became food-insecure in 2018, with the transitory secure group being the opposite case, where a household was food-insecure in 2015 and then food-secure in 2018. Finally, the chronically insecure group was food-insecure in both 2015 and 2018. All tests are relative to the transitory insecure food insecurity group.TABLE 6. Household descriptive statistics by change in food security status, 2018, Nigeria.
| Food security status | Transitory insecure | Chronically insecure | Test | Secure | Test | |||
|---|---|---|---|---|---|---|---|---|
| Variable | Mean | SD | Mean | SD | F-test | Mean | SD | F-test |
| Coping behaviors | 4.3 | 2.6 | 5.0 | 2.5 | F = 18.5*** | 0.0 | 0.0 | F = 475.7*** |
| Total expenditure (000 s) 2012 | 334.2 | 263.0 | 312.6 | 258.5 | F = 1.5 | 391.3 | 352.4 | F = 4.2** |
| Total expenditure per capita (000 s) 2012 | 84.0 | 77.0 | 76.0 | 79.9 | F = 2.2 | 90.4 | 99.3 | F = 0.6 |
| Age | 53.3 | 14.4 | 55.0 | 14.1 | F = 3.0* | 55.5 | 13.7 | F = 2.9* |
| Variable | N | Percent | N | Percent | Chi-squared | N | Percent | Chi-squared |
| HFIAP | 316 | 634 | χ2 = 18.4*** | — | — | — | ||
| Secure | 0 | 0% | 0 | 0% | — | — | — | |
| Mild | 76 | 24.1% | 96 | 15.1% | — | — | — | |
| Moderate | 80 | 25.3% | 129 | 20.3% | — | — | — | |
| Severe | 160 | 50.6% | 409 | 64.5% | — | — | — | |
| Sector | χ2 = 1.836 | χ2 = 4.191** | ||||||
| Rural | 211 | 66.8% | 452 | 71.3% | 136 | 76.0% | ||
| Urban | 105 | 33.2% | 182 | 28.7% | 54 | 24.0% | ||
| Education | 316 | 634 | χ2 = 11.9*** | 179 | χ2 = 1.2 | |||
| None | 136 | 43% | 271 | 42.7% | 81 | 45.3% | ||
| SSSC or lower | 128 | 40.5% | 300 | 47.3% | 64 | 35.8% | ||
| Professional degree | 31 | 9.8% | 29 | 4.6% | 20 | 11.2% | ||
| University degree | 21 | 6.6% | 34 | 5.4% | 14 | 7.8% | ||
| Zone | 316 | 634 | χ2 = 125.9*** | 179 | χ2 = 16.6*** | |||
| North Central | 83 | 26.3% | 46 | 7.3% | 41 | 22.9% | ||
| North East | 45 | 14.2% | 107 | 16.9% | 31 | 17.3% | ||
| North West | 59 | 18.7% | 71 | 11.2% | 44 | 24.6% | ||
| South East | 15 | 4.7% | 182 | 28.7% | 21 | 11.7% | ||
| South South | 53 | 16.8% | 124 | 19.6% | 19 | 10.6% | ||
| South West | 61 | 19.3% | 104 | 16.4% | 23 | 12.8% | ||
- Note: Statistical significance markers: *p < 0.1; **p < 0.05; ***p < 0.01.
While the chronically insecure group engaged in an average of 5.0 coping behaviors, the transitory insecure group engaged in an average of 4.3 coping behaviors. The chronically insecure group had a higher proportion of households that were severely food-insecure, at 62.9%; however, 50.6% of the transitory insecure group were also severely food-insecure. The transitory insecure group was more likely to have a younger head of household with a professional or university degree. The North Central zone is very much overrepresented in the transitory insecure group, which indicates that this region had a higher-than-average proportion of households becoming food-insecure in 2018. This region typically has the lowest rate of food insecurity in Nigeria. Relative to the secure group, the transitory insecure group had significantly lower total expenditure and a younger head of household, and were much more likely to be rural. The fact that the transitory insecure group was more like the chronically food-insecure group is supported by findings by Christiaensen and Boisvert (2000).
4.3 Regression Results
Here, we report the outcomes of the hurdle regression conducted to determine the severity of household coping. As a first step, households are separated into coping and non-coping. Next, a binary logistic regression is performed to establish the factors that determine whether a household falls into the coping or non-coping group. The results are presented in Table 7. Standard errors are clustered by households and enumeration area to account for repeated observations and unobservable differences, respectively.TABLE 7. Coping = 1 versus non-coping = 0 logistic regression, marginal effects.
| Variables | Coefficients |
|---|---|
| 2015 | −0.003 |
| 2018 | 0.106** |
| Agriculture | −0.072*** |
| 2015:Agriculture | 0.039 |
| 2018:Agriculture | 0.071** |
| Single parent | 0.027* |
| Total expenditure per capita (000 s) | −0.0002 |
| 2015:Total expenditure per capita (000 s) | −0.0004*** |
| 2018:Total expenditure per capita (000 s) | −0.0004*** |
| Employed | −0.093*** |
| 2015:Employed | 0.066* |
| 2018:Employed | 0.067* |
| Homeowner | −0.074*** |
| SSSC or lower | −0.002 |
| Professional degree | −0.096*** |
| University degree | −0.222*** |
| Urban | 0.026 |
| Proportion of children | 0.047** |
| North East | 0.075*** |
| North West | 0.051** |
| South East | 0.371*** |
| South South | 0.228*** |
| South West | 0.109*** |
| Observations | 13,582 |
| Log likelihood | −8206.58 |
| Akaike Inf. Crit. | 16,461.16 |
- Note: *p < 0.10; **p < 0.05; ***p < 0.01.
The year indicator variables show that households were not significantly more or less likely to be coping in 2015 and were 10.6% more likely to be coping in 2018 (not accounting for the year interactions with employment, agriculture, and total expenditure per capita). Single-parent households were 2.7% more likely to be coping,4 while homeowners were 7.4% less likely to be coping. The former is supported by the argument put forward by Law, Ward, and Coveney (2011) that single-parent households suffer more from food insecurity, while the latter is in accordance with the claim made by Fafard St-Germain and Tarasuk (2020) that home ownership lowers the degree of vulnerability to food insecurity. Higher levels of education also have a positive effect on food security; high school or less is not statistically different from no education, and we see an increasing effect with higher levels of education—heads of household with a professional degree were 9.6% less likely to be coping and those with a university degree 22.2% less likely to be coping. Overall, we are able to conclude that higher earnings associated with better education provide more resources to buy food, improved access to nutritious foods, and more options to cope with price shocks and food shortages (see Gebre 2021; Mutisya et al. 2016).
Although household expenditure per capita carries a negative sign, suggesting that higher expenditure decreases the likelihood of engaging in coping behavior, the coefficient is statistically insignificant. However, the effect becomes statistically significant in 2015 and 2018 relative to 2012. This is in agreement with past studies suggesting that food expenditure is the main constituent of household expenditure, and that increases in household expenditure lower food insecurity by raising food expenditure (see Kalaba et al. 2022; Rashid et al. 2024). In both 2015 and 2018, we found that a percentage increase in household expenditure lowers the probability of coping by about 0.4%. There is thus no significant difference between the effect of household expenditure in 2015 and 2018. In general, agricultural households were 7.2% less likely to be coping. This finding is just as reported by Abdoellah et al. (2023) that the average calorie adequacy of farmer households is usually higher. By 2015, however, the difference in coping behaviors between agricultural and non-agricultural households had disappeared, as the recorded coefficient had become statistically insignificant. The situation had worsened by 2018, as agricultural households became 7.1% more likely to be coping, which suggests agriculture may be considered to have become another coping behavior. Indeed, we find that the percentage of households involved in agriculture increased from 66.0% in 2015 to 75.1% in 2018. Taken together, this means that cash expenditures became more important for keeping households out of food insecurity in 2015 and 2018 as food prices rose relative to 2012. Households with a higher proportion of children were 4.6% more likely to be coping across all years, ratifying the conclusion by Drammeh, Hamid, and Rohana (2019) that a large family size places an extra burden on food consumption, thereby increasing the chances of food insecurity. Heads of household who are employed were 9.3% less likely to be coping, but just 2.7% less likely in 2015 and 2.6% less likely in 2018. This outcome is broadly in alignment with the conclusion reached by Mabli et al. (2023) that unemployment is associated with food insecurity. Overall, these results are consistent with the pattern observed in the descriptive statistics. Household characteristics that tended to shield households from food insecurity in 2012 became relatively less important in 2015 and 2018, with more households becoming food-insecure due to rising food prices.
Finally, relative to the North Central zone, where Abuja, the capital of Nigeria, is located, households in the North East and North West zones were 7.7% and 4.9% more likely to be coping with food insecurity, respectively, which is to be expected, as these regions are quite similar geographically. Households in the South East zone were 37.1% more likely to be coping, households in the South–South zone 22.5% more likely, and households in the South West zone 11.0% more likely to be coping with food insecurity. This is also consistent with patterns observed in the descriptive statistics, where households in the northern zones tend to be more food-secure, and households in the southern zones tend to be more food-insecure. The north tends to produce an agricultural surplus that is transported (with great difficulty) to the south, where there is typically an agricultural shortage.
Next, we investigate the severity of the food insecurity experienced by households that are, in fact, coping. This is done by using the number of coping behaviors in which a household engaged as a measure of the severity. We do this with a negative binomial regression to account for over-dispersion and excess zeros in the second stage of the hurdle regression. The results are presented in Table 8. The coefficients are presented as incident rate ratios, which are the multiplicative factor that increases or reduces the expected number of behaviors in which a household engages. For example, households on average in 2018 are expected to engage in 1.299 times the coping behaviors relative to 2012, whereas polygamous households are expected to engage in 0.954 times the coping behaviors on average relative to non-polygamous households.TABLE 8. Hurdle model, second-stage results, incident rate ratios (dependent variable = count of behaviors).
| Variables | Coefficients |
|---|---|
| 2015 | 1.015 |
| 2018 | 1.299** |
| Agriculture | 1.024 |
| 2015:Agriculture | 0.958 |
| 2018:Agriculture | 0.925* |
| Single parent | 1.050* |
| Polygamous | 0.954* |
| Distance to market | 0.998** |
| 2015:Distance to market | 1.001* |
| 2018:Distance to market | 1.003** |
| Total expenditure per capita (000 s) | 0.999** |
| Employed | 0.915** |
| Homeowner | 0.921** |
| SSSC or lower | 0.965* |
| Professional degree | 0.958 |
| University degree | 0.916** |
| Proportion of children | 1.095** |
| North East | 0.997 |
| North West | 0.987 |
| South East | 1.440** |
| South South | 1.343** |
| South West | 1.083** |
| Constant | 3.687** |
| Observations | 13,582 |
| Log likelihood | −25,290.64 |
- Note: *p < 0.05; **p < 0.01.
We find that agricultural households in 2018 are expected to engage in 0.925 times the coping behaviors of non-agricultural households. Indeed, the descriptive data show that in 2018, agricultural households were more likely to be in the mild and moderate HFIAP categories and less likely to be in the severe category. This makes intuitive sense, as agricultural households would have access to the basic staple foods that they grow. It is thus less likely that an agricultural household would completely run out of food at any given time.
The head of the household being employed significantly reduces the number of coping behaviors engaged in by a factor of 0.915, and owning their home reduces it by a factor of 0.921. These are clear income and wealth effects, respectively. Single parents were more likely to engage in more coping behaviors by a factor of 1.05, as were households with a higher proportion of children by a factor of 1.095. Conversely, polygamous households tended to engage in fewer types of coping behaviors by a factor of 0.954. Thus, just as in Owoo (2018), we are able to infer that at the household level, polygynous households enjoy better food security than monogamous households. These effects reflect the supply of labor relative to the number of dependents. The number of coping behaviors declined with household expenditure per capita by a factor of 0.999 per 1000 naira. Households further from agricultural markets tended to engage in fewer coping behaviors (factor of 0.998 per km). Relative to 2012, however, the trend reverses to become factors of 1.001 and 1.003 per km, respectively, in 2015 and 2018. Finally, there is no statistically significant difference in the coping behaviors of households in the North East, North West and North Central zones. Households in the South East (1.44 times more), South–South (1.34 times more), and South West (1.08 times more) all engaged in significantly more coping behaviors.
Finally, we identify the segments of the population that have engaged in severe coping behaviors by comparing these households with those that have engaged in moderate coping behaviors. Moderate coping behaviors include limiting portion sizes, reducing the number of meals, restricting adult consumption and borrowing food. Severe coping behaviors are no food in the household, going to sleep hungry and going a whole day and night without eating. We assess the determinants that tip a household into severe food insecurity compared with moderate food insecurity (Table 9).TABLE 9. Logistic regression results: moderate = 0 versus severe = 1, marginal effects (dependent variable = severe).
| Variables | Coefficients |
|---|---|
| 2015 | −0.181** |
| 2018 | 0.195** |
| log_dist_market | −0.070*** |
| time2015:log_dist_market | 0.047** |
| time2018:log_dist_market | 0.095*** |
| Gender | −0.507*** |
| gender:log_age | 0.140** |
| log_age | −0.201*** |
| hh_agri | 0.061* |
| gender:hh_agri | −0.085** |
| single_parent | 0.045 |
| Polygamous | −0.054** |
| tot_exp_capita | −0.0002* |
| hh_employed | −0.072*** |
| own_home | −0.049** |
| SSSC or lower | −0.056*** |
| Professional degree | −0.068* |
| University degree | −0.077* |
| i_children_less_15 | −0.052** |
| hhsize | −0.022*** |
| gender:hhsize | 0.021** |
| n_elderly | 0.258*** |
| gender:n_elderly | −0.221*** |
| North East | 0.071 |
| North West | 0.02 |
| South East | 0.150*** |
| South South | 0.146*** |
| South West | −0.057 |
| Observations | 6354 |
| Log likelihood | −3514.95 |
- Note: *p < 0.10; **p < 0.05; ***p < 0.01.
We find that while households were 18.1% less likely to be severely food-insecure in 2015 than in 2012, households were 19.5% more likely to be severely food-insecure in 2018 than in 2012. In general, households further from the market were 7% less likely to be severely food-insecure per 1% increase in the distance to the market. This confirms previous findings that access to market is a key determinant of food insecurity (see Hoang 2018; Munawar et al. 2021). However, as food prices began to increase in 2015, we saw a change in the probability, as households further away from the market became 4.7% more likely to be severely food-insecure per percentage increase in distance. By 2018, the probability of severity increases to 9.5% per percentage increase in distance.
Whereas single parenthood is the key family structure factor determinant of whether or not households engaged in coping behaviors, gender is the key family structure determinant for moderate versus severe coping behaviors. Studies such as Olagunju et al. (2012) and Sekhampu (2017) also report that household headship is a useful predictor of food security, and that female-headed households tend to be more at risk of food insecurity. There are several important differences by gender of the head of household. Overall, male-headed households were 50.7% less likely to engage in severe coping behaviors (in line with the raw data) than female-headed households, when interactions are not accounted for. Several parameter estimates reveal various gender-related effects when interactions are considered. For instance, compared to their male counterparts, the likelihood of severe coping behaviors in female-headed households tends to be 14% lower for every additional year. These results indicate that whereas male-headed households start out as being more food-secure, as the ages of the heads of the households increased, food security increased at a greater rate in female-headed than in male-headed households. The likelihood of severe coping behaviors in male-headed agricultural households tended to be 8.5% lower than in female-headed agricultural households. This may be due to females having considerably weaker land rights than males in Nigeria (Ajala 2017), which would make agriculture undertaken by female-headed households less productive on average. Also, for every unit increase in household size, male-headed households tended to be 2.1% more likely to exhibit severe coping behaviors than their female counterparts. This may have to do with the fact that additions to female-headed households are often as a result of widows remarrying, whereas additions to male-headed households are due to additional wives and children. While remarriages by widows mostly introduce additional breadwinners into the family, additional children and wives increase the number of dependents. Finally, households headed by elderly males (85 years of age and older) were 22.1% less likely to exhibit severe coping behaviors than their female counterparts.
Additional revelations are as follows. For every additional year to age, the likelihood that households will engage in severe coping behaviors decreased by 20.1%. Agricultural households were 6.1% more likely to engage in severe coping behaviors. Polygamous households were 5.4% less likely to experience severe coping behaviors. Expenditure per capita decreased the probability of severe coping behaviors, although its effect is almost negligible. The employment status of the head of household is also important, as employed heads of household were 7.2% less likely to experience severe food insecurity. Homeowners were 4.9% less likely to experience severe food insecurity, and households with children under the age of 15 were 5.2% less likely to experience severe food insecurity. Every addition to household membership diminishes the probability of severe food insecurity by about 2.2%. Households headed by people aged 85 years or above were 25.8% more likely to experience food insecurity. We also find that the chances of severe food insecurity were lower in households headed by people with higher education. With regard to the zones, although no significant difference exists in the probability of severe food insecurity among the northern zones, the probability of severe food insecurity was higher in the South East and South West zones than in the benchmark zone (North Central).
5 Conclusion
In the face of a deep currency devaluation and soaring food prices in a country that had become heavily reliant on readily available foreign exchange and cheap imported food, the Nigerian government chose to forbid the use of foreign exchange for the import of food. This policy effectively banned the import of many staple food items to Nigeria under the guise of stimulating the domestic output of these staples. Unfortunately, Nigeria lacks the capacity to produce anywhere near the amount of the staples imported in recent years, and once-busy processing facilities sit idle. Consequently, real food prices have risen in Nigeria, despite real food prices falling globally. These patterns of adjustment suggest that coping behaviors are not merely temporary responses but create a new normal in which reduced meal frequency, substitution of staples, and informal credit reliance become embedded features of daily life. As food prices rose, the prevalence and severity of household food insecurity in Nigeria have also increased. This paper investigates the changes in the types and severity of food insecurity coping behaviors caused by the food price shock resulting from the combined effect of the oil price crash, currency devaluation and foreign exchange restrictions. Specifically, Nigeria’s General Household Survey Panel data from 2012 and 2015, when oil prices were high (or had only recently fallen), was compared with data from 2018, when oil prices had been persistently low, the currency had been devalued and the treasury had been depleted.
Our findings reveal that overall, a large increase in the proportion of Nigerian households coping with food insecurity occurred between 2015 and 2018; 68.7% of all households engaged in at least one coping behavior and nearly one-third (31.8%) of all households engaged in six or more coping behaviors. In terms of the severity of those behaviors, 62.9% of coping households engaged in severe coping behaviors such as running out of food or going a whole day and night without eating. This means that of all households in Nigeria, 43.2% had to engage in severe coping behaviors. This is a famine caused not so much by natural disaster or conflict as by a failure of macroeconomic and agricultural economic policy.
Typical types of households affected by moderate or severe food insecurity in 2018 are identified. One group is predominantly female-headed single-parent households, the majority located in the rural areas south of Nigeria. These households are less likely to be involved in agriculture, probably due to an inability to own land. This means that they must face the higher cost of food in rural Nigeria without the support of subsistence agriculture. Furthermore, these heads of household are much less likely to be employed outside the home, yet many are mothers to at least one child under the age of 15.
The second typical group to be discussed is rural households, mostly from the north. Most of these are male-headed households and are much more likely to be polygamous. These households have more members than average, and more children than average. They are almost all involved in subsistence agriculture and have very low total expenditures per capita. This suggests that they rely on agriculture for most of their basic needs and supplement this with some food purchased in the market. These families have shown significant resilience against the massive increase in the price of food and have remained relatively more food-secure.
The final typical household to be discussed is predominantly rural but tends to live further away from the agricultural markets and in the south of Nigeria. The heads of household tend to be older than average and are likely to be engaged in agriculture and/or labor outside the household. These households tend to have more members and have more than two children on average. This group also has low expenditure per capita, which suggests that the small amount of cash they have to spend on food to supplement their diet buys much less than it once did, pushing them and their children into food insecurity.
While this effective import ban policy has indeed achieved the stated goal of increasing the profitability of domestic agriculture, by 2020 Nigeria was still importing more than 95% of its wheat and sugar. This policy has effectively created an import quota for anyone who receives an official exemption. Given that real food prices fell globally from 2012 to 2018 and rose in Nigeria, massive rents must certainly be accruing to anyone able to import the import-controlled goods. One notable example of such an occurrence is when, in August 2019, the Central Bank told lenders to stop offering credit to importers of milk after saying it would ban access to foreign exchange for dairy purchases to spur local production. It later lifted forex restrictions for milk imports for six firms following an outcry from businesses (Reuters and Ohuocha 2021).
Overall, our findings confirm that these policies of the Nigerian government come at a great cost to current generations, particularly female-headed households, single-parent households, households headed by elderly people, and other vulnerable populations, pushing them deeper into food insecurity. The decision taken in October 2023 by the Nigerian government, through the Central Bank, to lift the foreign exchange restriction placed on essential agricultural and food items is therefore a good decision that perhaps came a little too late. Another important discovery is that the government’s policy of providing financial support for small-scale farming that dominates the agricultural landscape in Nigeria cannot achieve anywhere near the productivity of large-scale agriculture. In spite of all the major investments made in the agricultural sector in Nigeria, there has been very limited improvement in the volume of output. This may be tied to the fact that most of these investments, rather than being channeled into large-scale, mechanized agriculture, are being used to support small-scale agri-businesses. This study also highlights the extent to which the Nigerian government was unprepared for food price shocks. While the government had every opportunity to prepare for a potential food shortage when oil prices were high and government coffers were full, it abjectly failed to do so. Indeed, strategic grain reserves, a tool successfully used by the Indonesian government since the 1970s, have been built in Nigeria but have been woefully underfunded and lie idle. This vast network of silos is to be sold off to private investors—no doubt at a loss to the government—in another obvious instance of mismanagement at best, or outright corruption at worst.
This food security crisis, while certainly not created by the Nigerian government, has been mismanaged and exacerbated by misguided policy. This is a multi-faceted failure of policy. First, the agricultural sector and infrastructure required to support it is far behind where it could have otherwise been due to years of neglect toward developing that sector. When the Nigerian government finally decided to stimulate domestic agricultural output, they chose to do so by increasing food prices after they had already risen sharply due to the collapse of the currency. This is a failure of trade policy, as Nigeria is not allowing free and open trade for a wide range of basic goods. Finally, this is the result of a failure of macroeconomic policy, as the Central Bank policy of maintaining a fixed exchange rate has proved unsustainable. Taken together, these policies have had negative impacts on a great number of Nigerians and will have long-lasting consequences for children who grow up in these times of heightened food insecurity.
Acknowledgments
The authors are highly indebted to Richard Barichello and two anonymous reviewers for providing useful comments on an earlier version of the manuscript.
Ethics Statement
The authors have nothing to report.
Consent
The authors have nothing to report.
Conflicts of Interest
The authors declare no conflicts of interest.
Endnotes
1https://www.cbn.gov.ng/OUT/PUBLICATIONS/REPORTS/RD/2000/HALF-YR2000.PDF.2https://www.worldbank.org/en/country/nigeria/overview#1.3 Extreme poverty is defined as living on less than 137,430 naira per day—equivalent to approximately $1 USD per day.4 Note that the indicator variable for polygamous households is not significant in the first stage regression; however, it is significant in the second stage on the number of behaviours.
Data Availability Statement
The data that support the findings of this study are available from the corresponding author upon reasonable request.
References
- Abdoellah, O. S., Y. Suparman, K. I. Safitri, et al. 2023. “Food Security of Urban Agricultural Households in the Area of North Bandung, West Java, Indonesia.” Sustainability 15, no. 24: 16683.ViewGoogle Scholar
- Ajala, T. 2017. “Gender Discrimination in Land Ownership and the Alleviation of women’s Poverty in Nigeria: A Call for New Equities.” International Journal of Discrimination and the Law 17, no. 1: 51–66. https://doi.org/10.1177/13582291177000.ViewGoogle Scholar
- Akerele, D., S. Momoh, A. B. Aromolaran, C. R. Oguntona, and A. M. Shittu. 2013. “Food Insecurity and Coping Strategies in South-West Nigeria.” Food Security 5: 407–414. https://doi.org/10.1007/s12571-013-0264-x.ViewGoogle Scholar
- Alake, T. 2021. “Dollar Ban for Wheat May Add to Nigeria Food Scarcity.” https://www.bloomberg.com/news/articles/2021-04-21/nigeria-dollar-ban-forwheat-and-sugar-may-add-to-food-scarcity.Google Scholar
- Banik, D. 2007. Starvation and India’s Democracy, Vol. 8. London: Routledge.ViewGoogle Scholar
- Biadgilign, S. 2023. “Coping Strategies to Mitigate Food Insecurity at Household Level: Evidence From Urban Setting in Addis Ababa, Ethiopia.” INQUIRY: The Journal of Health Care Organization, Provision, and Financing 60: 00469580231206263.ViewPubMedGoogle Scholar
- Chaudhuri, S., M. Roy, L. M. McDonald, and Y. Emendack. 2021. “Coping Behaviors and the Concept of Time Poverty: A Review of Perceived Social and Health Outcomes of Food Insecurity on Women and Children.” Food Security 13, no. 4: 1049–1068.ViewGoogle Scholar
- Choi, S., D. Furceri, P. Loungani, S. Mishra, and M. Poplawski-Ribeiro. 2018. “Oil Prices and Inflation Dynamics: Evidence From Advanced and Developing Economies.” Journal of International Money and Finance 82: 71–96. https://doi.org/10.1016/j.jimonfin.2017.12.004.ViewWeb of Science®Google Scholar
- Christiaensen, L. J., and R. N. Boisvert. 2000. “On Measuring Household Food Vulnerability: Case Evidence from Northern Mali.” Working Paper: Department of Applied Economics and Management, Cornell University, Ithaca, New York.Google Scholar
- Christian, P. 2010. “Impact of the Economic Crisis and Increase in Food Prices on Child Mortality: Exploring Nutritional Pathways.” Journal of Nutrition 140, no. 1: 177S–181S. https://doi.org/10.3945/jn.109.111708.ViewCASPubMedWeb of Science®Google Scholar
- Coates, J., and P. B. Swindale. 2007. “Household Food Insecurity Access Scale (HFIAS) for Measurement of Food Access: Indicator Guide.” Food and Nutrition Technical Assistance, Version 3.Google Scholar
- Cologni, A., and M. Manera. 2008. “Oil Prices, Inflation and Interest Rates in a Structural Cointegrated VAR Model for the G-7 Countries.” Energy Economics 30, no. 3: 856–888. https://doi.org/10.1016/j.eneco.2006.11.001.ViewWeb of Science®Google Scholar
- Danso-Abbeam, G., M. A. Asale, and A. A. Ogundeji. 2023. “Determinants of Household Food Insecurity and Coping Strategies in Northern Ghana.” GeoJournal 88, no. 2: 2307–2324.ViewGoogle Scholar
- Davies, S. 1993. “Are Coping Strategies a Cop Out?” IDS Bulletin 24, no. 4: 60–72. https://doi.org/10.1111/j.1759-5436.1993.mp24004007.x.ViewWeb of Science®Google Scholar
- Devereux, S. 2001. “Livelihood Insecurity and Social Protection: A Re-Emerging Issue in Rural Development.” Development and Policy Review 19, no. 4: 507–519. https://doi.org/10.1111/1467-7679.00148.ViewGoogle Scholar
- Dlamini, S. N., A. Craig, A. Mtintsilana, et al. 2023. “Food Insecurity and Coping Strategies and Their Association With Anxiety and Depression: A Nationally Representative South African Survey.” Public Health Nutrition 26, no. 4: 705–715.ViewGoogle Scholar
- Dore, A. R., L. S. Adair, and B. M. Popkin. 2003. “Low Income Russian Families Adopt Effective Behavioral Strategies to Maintain Dietary Stability in Times of Economic Crisis.” Journal of Nutrition 133, no. 11: 3469–3475. https://doi.org/10.1093/jn/133.11.3469.ViewCASPubMedGoogle Scholar
- Drammeh, W., N. A. Hamid, and A. J. Rohana. 2019. “Determinants of Household Food Insecurity and Its Association With Child Malnutrition in Sub-Saharan Africa: A Review of the Literature.” Current Research in Nutrition and Food Science Journal 7, no. 3: 610–623.ViewWeb of Science®Google Scholar
- Fafard St-Germain, A. A., and V. Tarasuk. 2020. “Homeownership Status and Risk of Food Insecurity: Examining the Role of Housing Debt, Housing Expenditure and Housing Asset Using a Cross-Sectional Population-Based Survey of Canadian Households.” International Journal for Equity in Health 19: 1–12.ViewGoogle Scholar
- FAO, UNICEF, IFAD, and WFP. 2019. “The State of Food Security and Nutrition in the World 2019: Safeguarding Against Economic Slowdowns and Downturns.” FAO, Rome.Google Scholar
- Farzana, F. D., A. S. Rahman, S. Sultana, et al. 2017. “Coping Strategies Related to Food Insecurity at the Household Level in Bangladesh.” PLoS One 12, no. 4: e0171411. https://doi.org/10.1371/journal.pone.0171411.ViewPubMedGoogle Scholar
- Food and Agriculture Organization of the United States (FAO). 2008. “The State of Food Insecurity in the World. High Food Prices and Food Security – Threats and Opportunities.” FAO, Rome. http://www.fao.org/3/i0291e/i0291e.pdf.Google Scholar
- Food and Agriculture Organization of the United States (FAO). 2013. “The State of Food Insecurity in the World 2013: The Multiple Dimensions of Food Security.” FAO, Rome. http://www.fao.org/3/i3434e/i3434e.pdf.Google Scholar
- Food and Agriculture Organization of the United States (FAO). 2021. “FAO Food Price Index.” https://www.fao.org/worldfoodsituation/foodpricesindex/en.Google Scholar
- Gebre, G. G. 2021. “Prevalence of Household Food Insecurity in East Africa: Linking Food Access With Climate Vulnerability.” Climate Risk Management 33: 100333.ViewWeb of Science®Google Scholar
- Grobler, W. C. 2014. “Food Insecure Household Coping Strategies: The Case of a Low Income Neighborhood in South Africa.” Mediterranean Journal of Social Sciences 5: 100–106.Google Scholar
- Gundersen, C., and J. P. Ziliak. 2014. “Childhood Food Insecurity in the US: Trends, Causes, and Policy Options.” Future of Children 24: 1–19. https://doi.org/10.1353/foc.2014.0007.ViewWeb of Science®Google Scholar
- Gupta, P., K. Singh, V. Seth, S. Agarwal, and P. Mathur. 2015. “Coping Strategies Adopted by Households to Prevent Food Insecurity in Urban Slums of Delhi, India.” Journal of Food Security 3, no. 1: 6–10. https://doi.org/10.12691/jfs-3-1-2.ViewGoogle Scholar
- Hoang, H. K. 2018. “Analysis of Food Demand in Vietnam and Short-Term Impacts of Market Shocks on Quantity and Calorie Consumption.” Agricultural Economics 49, no. 1: 83–95.ViewWeb of Science®Google Scholar
- Ivanic, M., and W. Martin. 2008. “Implications of Higher Global Food Prices for Poverty in Low-Income Countries.” Agricultural Economics 39: 405–416. https://doi.org/10.1111/j.1574-0862.2008.00347.x.ViewWeb of Science®Google Scholar
- Ivanic, M., W. Martin, and H. Zaman. 2012. “Estimating the Short-Run Poverty Impacts of the 2010–11 Surge in Food Prices.” World Development 40, no. 11: 2302–2317. https://doi.org/10.1016/j.worlddev.2012.03.024.ViewWeb of Science®Google Scholar
- Kalaba, Y., W. P. Sh, L. Damayanti, et al. 2022. “ Analysis of Household Food Security Based on the Share of Food Expenditure in Central Sulawesi Indonesia.” In IOP Conference Series: Earth and Environmental Science, 1107, no. 1, p. 012090. Montreal, Canada: IOP Publishing.ViewGoogle Scholar
- Kempson, K., D. P. Keenan, P. S. Sadani, and A. Adler. 2003. “Maintaining Food Sufficiency: Coping Strategies Identified by Limited-Resource Individuals Versus Nutrition Educators.” Journal of Nutrition Education and Behavior 35, no. 4: 179–188. https://doi.org/10.1016/s1499-4046(06)60332-1.ViewPubMedGoogle Scholar
- Kyaw, D. 2009. “Rural Households’ Food Security Status and Coping: Strategies to Food Insecurity in Myanmar.” Institute of Developing Economies, Japan External Trade Organization.Google Scholar
- Law, I. R., P. R. Ward, and J. Coveney. 2011. “Food Insecurity in South Australian Single Parents: An Assessment of the Livelihoods Framework Approach.” Critical Public Health 21, no. 4: 455–469.ViewGoogle Scholar
- Mabli, J., K. Monzella, R. L. Franckle, and P. L. Delgado. 2023. “Food Insecurity Transitions and Changes in Employment and Earnings.” American Journal of Preventive Medicine 64, no. 3: 368–376.ViewPubMedGoogle Scholar
- Mabuza, M. L., G. F. Ortmann, and E. Wale. 2016. “Frequency and Extent of Employing Food Insecurity Coping Strategies Among Rural Households: Determinants and Implications for Policy Using Evidence From Swaziland.” Food Security 8: 255–269. https://doi.org/10.1007/s12571-015-0527-9.ViewWeb of Science®Google Scholar
- Maxwell, D., and R. Caldwell. 2008. “The Coping Strategies Index: A Tool for Rapid Measurement of Household Food Security and the Impact of Food Aid Programs in Humanitarian Emergencies.” Field Methods Manual, 2.Google Scholar
- Mekonnen, D. A., D. Akerele, T. Achterbosch, T. De Lange, and E. F. Talsma. 2021. “Affordability of Healthy and Sustainable Diets in Nigeria.” Frontiers in Sustainable Food Systems 5: 726773.ViewGoogle Scholar
- Mishra, S. 2007. “Household Livelihood and Coping Mechanism During Drought Among Oraon Tribe of Sundargarh District of Orissa, India.” Journal of Social Sciences 15, no. 2: 181–186. https://doi.org/10.1080/09718923.2007.11892580.ViewGoogle Scholar
- Mjonono, M., M. Ngidi, and S. L. Hendriks. 2009. “Investigating Household Food Insecurity Coping Strategies and The Impact of Crop Production on Food Security Using Coping Strategy Index (CSI).” In 17th International Farm Management Congress, Bloomington/Normal, Illinois, USA.Google Scholar
- Mokni, K., and O. Ben-Salha. 2020. “Asymmetric Causality in Quantiles Analysis of the Oil-Food Nexus Since the 1960s.” Resources Policy 69: 101874. https://doi.org/10.1016/j.resourpol.2020.101874.ViewWeb of Science®Google Scholar
- Munawar, M., X. Shiwei, Y. Wen, and M. Luqman. 2021. “Investigating Relationship of Food Security With Market Approachability With Respect to Household Food Insecurity Access Index.” Journal of Economic Impact 3, no. 3: 130–136.ViewGoogle Scholar
- Mutisya, M., M. W. Ngware, C. W. Kabiru, and N. B. Kandala. 2016. “The Effect of Education on Household Food Security in Two Informal Urban Settlements in Kenya: A Longitudinal Analysis.” Food Security 8: 743–756.ViewWeb of Science®Google Scholar
- Nakanwagi, T., H. Ntuli, and E. Muchapondwa. 2021. “Food Price Shock, Food Security and Potential Mitigation Strategies in Malawi.” Available at SSRN 3860635.Google Scholar
- National Bureau of Statistics. 2020a. “2019 Poverty and Inequality in Nigeria: Executive Summary.”Google Scholar
- National Bureau of Statistics. 2020b. “General Household Survey, Panel (GHS-Panel) 2018–2019.” http://www.microdata.worldbank.org/.Google Scholar
- Nazlioglu, S., and U. Soytas. 2011. “World Oil Prices and Agricultural Commodity Prices: Evidence From an Emerging Market.” Energy Economics 33, no. 3: 488–496. https://doi.org/10.1016/j.eneco.2010.11.012.ViewWeb of Science®Google Scholar
- Nekmahmud, M. 2024. “Food Consumption Behavior, Food Supply Chain Disruption, and Food Security Crisis During the COVID-19: The Mediating Effect of Food Price and Food Stress.” Journal of Foodservice Business Research 27, no. 3: 227–253.ViewGoogle Scholar
- Norhasmah, S., Jr., M. S. Zalilah, M. T. Mohd Nasir, M. Kandiah, and A. S. Asnarulkhadi. 2010. “A Qualitative Study on Coping Strategies Among Women From Food Insecurity Households in Selangor and Negeri Sembilan.” Malaysian Journal of Nutrition 16, no. 1: 39–54.PubMedGoogle Scholar
- Olagunju, F. I., J. T. O. Oke, R. O. Babatunde, and A. Ajiboye. 2012. “Determinants of Food Insecurity in Ogbomoso Metropolis of Oyo State, Nigeria.” Pat 8, no. 1: 111–124.Google Scholar
- Orewa, S. I., and C. O. Iyangbe. 2010. “Determinants of Daily Food Calorie Intake Among Rural and Low Income Urban Households in Nigeria.” Academic Journal of Plant Sciences 3, no. 4: 147–155.Google Scholar
- Owoo, N. S. 2018. “Food Insecurity and Family Structure in Nigeria.” SSM-Population Health 4: 117–125.ViewPubMedGoogle Scholar
- Quinton, J., G. P. Jenkins, and G. Olasehinde-Williams. 2023. “Benefit of Hindsight: Did the 2015 Oil Price Shock and Policy Response Play Any Role in Household Food Insecurity in Nigeria? (No. 2023-12).” JDI Executive Programs.Google Scholar
- Quisumbing, A., R. Meinzen-Dick, and L. Bassett. 2008. “Helping Women Respond to the Global Food Price Crisis.” Policy Brief 7. International Food Policy Research Institute, Washington, DC.Google Scholar
- Rashid, F. N., J. K. Sesabo, R. M. Lihawa, and E. Mkuna. 2024. “Determinants of Household Food Expenditure in Tanzania: Implications on Food Security.” Agriculture & Food Security 13, no. 1: 13.ViewWeb of Science®Google Scholar
- Reuters, and C. Ohuocha. 2021. “Nigeria to Halt Foreign Currency for Sugar, Wheat Imports – Central Bank.” Reuters. https://www.reuters.com/world/africa/nigeria-halt-foreign-currency-sugar-wheat-imports-central-bank-2021-04-16/.Google Scholar
- Ruel, M. T., J. L. Garrett, C. Hawkes, and M. J. Cohen. 2010. “The Food, Fuel, and Financial Crises Affect the Urban and Rural Poor Disproportionately: A Review of the Evidence.” Journal of Nutrition 140, no. 1: 170S–176S. https://doi.org/10.3945/jn.109.110791.ViewCASPubMedWeb of Science®Google Scholar
- Sani, S., and B. Kemaw. 2019. “Analysis of Households Food Insecurity and Its Coping Mechanisms in Western Ethiopia.” Agricultural and Food Economics 7, no. 1: 5.ViewGoogle Scholar
- SB Morgen. 2021. “Nigerians Just Want to Eat.” Technical Report. https://www.sbmintel.com/2021/01/nigerians-just-want-to-eat/.Google Scholar
- Sekhampu, T. J. 2017. “Association of Food Security and Household Demographics in a South African Township.” International Journal of Social Sciences and Humanity Studies 9, no. 2: 157–170.Google Scholar
- Shamsudin, P. D. D. M. N. 2019. “Food Insecurity: Coping Strategies and Policy Responds.” Universiti Putra Malaysia.Google Scholar
- Snel, E., and R. Staring. 2001. “Poverty, Migration, and Coping Strategies: An Introduction.” Focaal: European Journal of Anthropology 38: 7–22.Google Scholar
- Sun, Y., P. Gao, S. A. Raza, N. Shah, and A. Sharif. 2023. “The Asymmetric Effects of Oil Price Shocks on the World Food Prices: Fresh Evidence From Quantile-On-Quantile Regression Approach.” Energy 270: 126812. https://doi.org/10.1016/j.energy.2023.126812.ViewWeb of Science®Google Scholar
- Tamirisa, N. T. 1999. “Exchange and Capital Controls as Barriers to Trade.” IMF Staff Papers 46, no. 1: 69–88.ViewWeb of Science®Google Scholar
- Thomas, A., M. A. H. Thomas, M. R. A. Turk, and R. Turk. 2023. Food Insecurity in Nigeria: Food Supply Matters. Nigeria: International Monetary Fund.Google Scholar
- Tsegaye, A. T., A. Tariku, A. G. Worku, et al. 2018. “Reducing Amount and Frequency of Meal as a Major Coping Strategy for Food Insecurity.” Archives of Public Health 76: 1–9.ViewPubMedGoogle Scholar
- Uddin, M. E. 2012. “Household Food Security Status of Marginal Farmers in Selected Storm Surge Prone Coastal Area of Bangladesh.” Agriculturists 10, no. 1: 98–103. https://doi.org/10.3329/agric.v10i1.11070.ViewGoogle Scholar
Citing Literature
Number of times cited according to CrossRef: 1
- C.A. Igene, N.E. Belonwu, M. Elusaiwe, J.U. Amah, COPING STRATEGIES OF FOOD SECURITY: A PERSPECTIVE OF FEMALE-HEADED HOUSEHOLDS IN ESAN WEST LOCAL GOVERNMENT AREA, JOURNAL OF ARID AGRICULTURE, 10.63659/jaa.v26i1.72, Vol. 26, 1, (103-113), (2025).View
